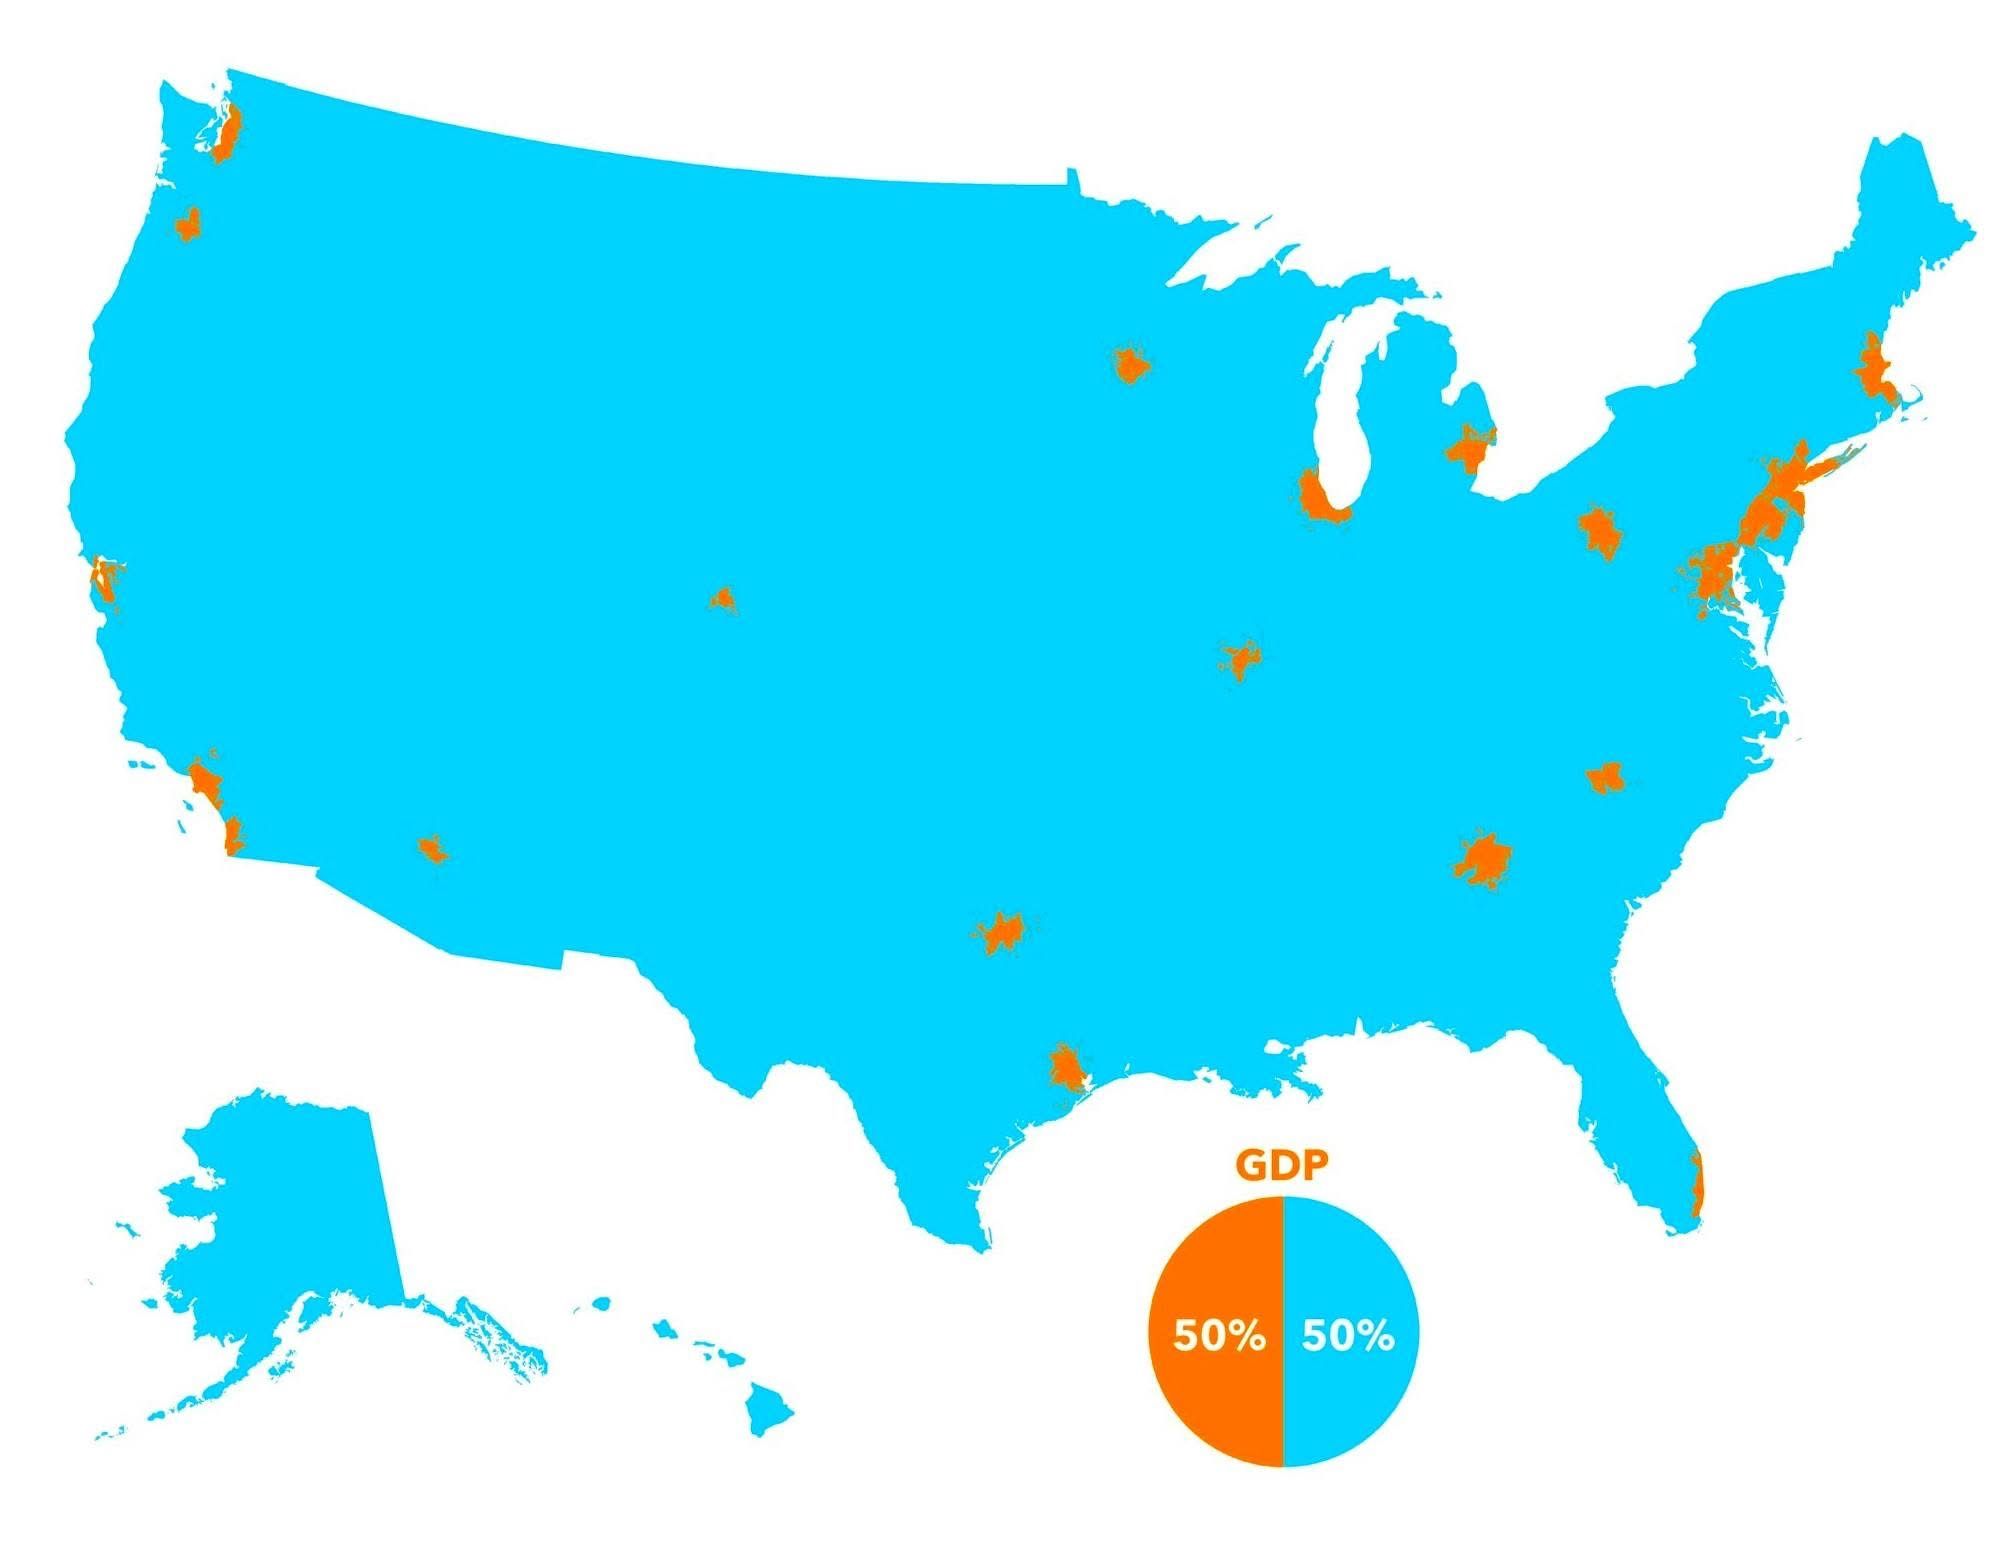
Now that’s an amazing map
-
@89th said in Now that’s an amazing map:
That's also a map of which areas (orange) would starve first if the blue area stops farming!
First thought I had...
@Jolly said in Now that’s an amazing map:
@89th said in Now that’s an amazing map:
That's also a map of which areas (orange) would starve first if the blue area stops farming!
First thought I had...
First thought I had was that you were going to make that point.
-
@Jolly said in Now that’s an amazing map:
@89th said in Now that’s an amazing map:
That's also a map of which areas (orange) would starve first if the blue area stops farming!
First thought I had...
First thought I had was that you were going to make that point.
@jon-nyc said in Now that’s an amazing map:
@Jolly said in Now that’s an amazing map:
@89th said in Now that’s an amazing map:
That's also a map of which areas (orange) would starve first if the blue area stops farming!
First thought I had...
First thought I had was that you were going to make that point.
Ring it, mine the periphery, try to cut off the inbound ships and let the rats eat each other.
Should only take a few weeks.
-
I guess the percentage of the population living in those areas, while less than 50%, is also a quite significant fraction of the total population.
@Klaus said in Now that’s an amazing map:
I guess the percentage of the population living in those areas, while less than 50%, is also a quite significant fraction of the total population.
Yes. That’s why color coded county level maps showing voting patterns are so misleading.
-
I saw a similar map (which I cannot find now. aargh) which compared the GDP of Silicon Valley to the fifty states (did not include our 51st state - Canada. LOL).
Anyway, the GDP of Silicon Valley was higher than the GPD of at least 35 states.
But, as was pointed out by folks like @89th and @Jolly, it is a "symbiosis" relationship. One would not survive with out the other.

