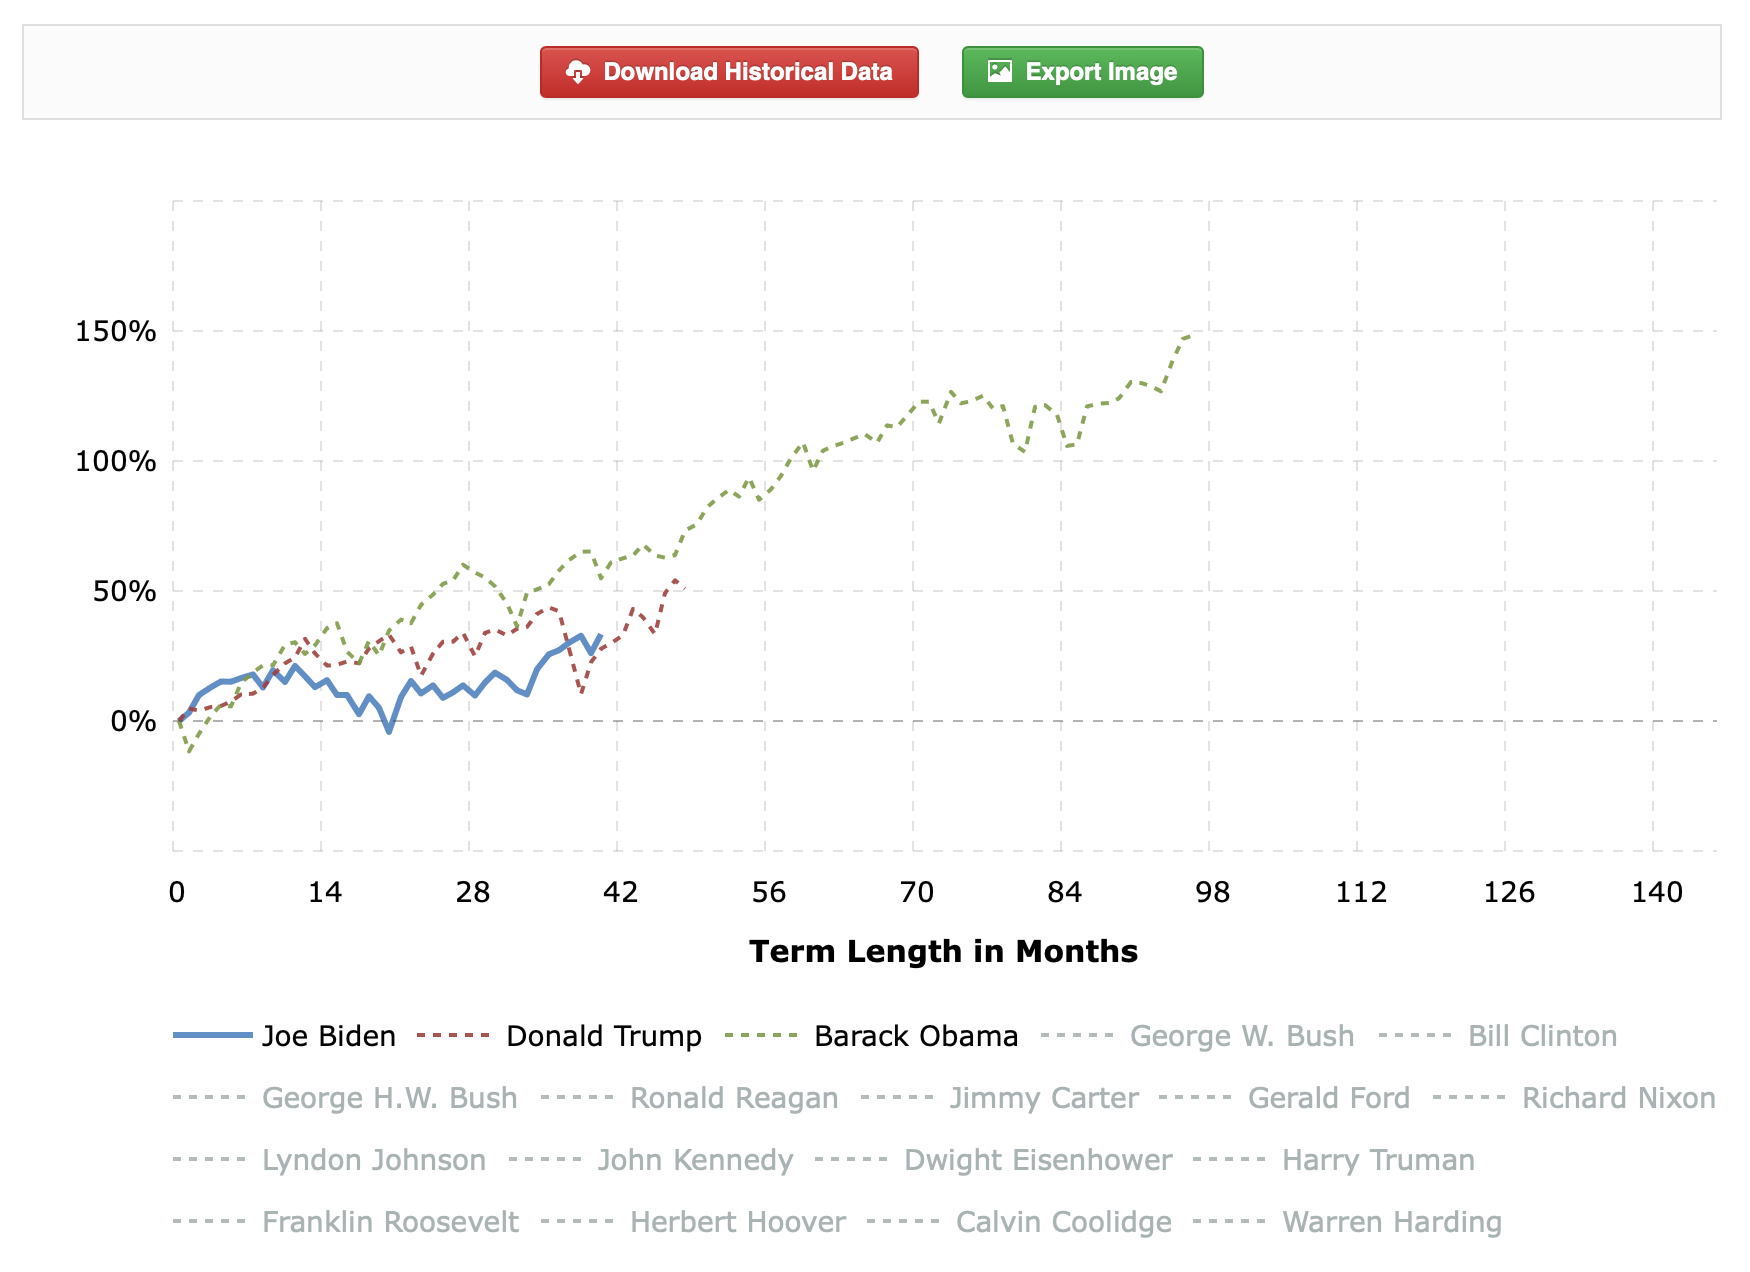
Bidenomics
-
About home buying affordability referenced in reply #81, this is the underlying study:
https://www.bankrate.com/real-estate/home-affordability-in-current-housing-market-study/
Out of all 50 states and the District of Columbia, California requires the highest annual salary to afford a typical home at $197,057, followed by:
Hawaii: $185,829
District of Columbia: $167,871
Massachusetts: $162,471
Washington: $156,814Mississippi requires the lowest income to afford a home in the U.S. at $63,043, followed by:
Ohio: $64,071
Arkansas: $64,714
Indiana: $65,143
Kentucky: $65,1865 states where income required to afford a typical home grew the most
Skyrocketing home prices in these states mean higher salaries are needed to afford a typical home
Montana experienced the most significant increase of income needed to afford a typical home between January 2020 and January 2024, followed by Utah, Tennessee, South Carolina and Arizona.5 states where income required to afford a typical home grew the least
The annual salary needed to afford a typical home grew the least in North Dakota, the District of Columbia, Louisiana, Illinois and Kansas between January 2020 and January 2024.By “salary,” I think they mean household income, or “combined salary” of both spouses; in which case $110,871 means roughly $55.5k each for a two-income household.
-
@Axtremus said in Bidenomics:
Biden is owning it.
Surging gas prices and sky-high mortgages and rent sent inflation rising more than expected in March, adding to Americans’ prolonged and painful battle with high costs. That could force the Federal Reserve to keep its punishing rates higher for longer.
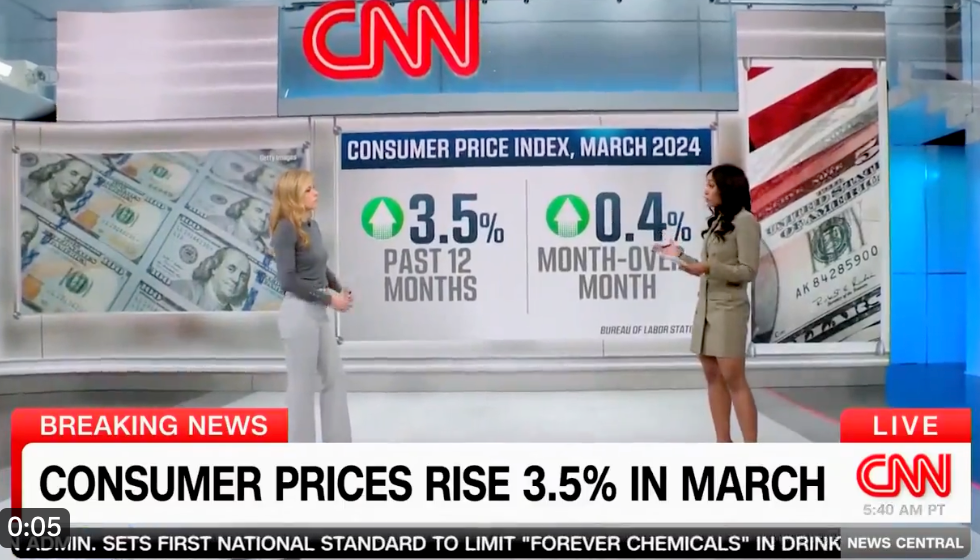
US consumer prices picked up again last month, vaulting to a 3.5% increase for the 12 months ended in March, according to the latest Consumer Price Index data released Wednesday by the Bureau of Labor Statistics.
That’s up considerably from February’s 3.2% rate and marks the highest annual gain in the past six months. Friday’s report further highlights that the path to lower inflation remains extremely bumpy — and continue to be a drag on Americans’ hard-earned finances — and that any loosening of monetary policy might not happen soon.
“You can kiss a June interest rate cut goodbye,” Greg McBride, chief financial analyst for Bankrate, wrote in commentary issued Wednesday.
US futures tanked Wednesday after the release of the hotter-than-expected inflation data, with Dow futures falling by more than 475 points. Futures on the S&P fell by 1.25% and Nasdaq futures slipped by 1.3%. Treasury yields topped 4.5%.
-
It seems to me that the market didn’t exactly take off with the recent wonderful jobs report…
-
It seems to me that the market didn’t exactly take off with the recent wonderful jobs report…
@LuFins-Dad said in Bidenomics:
It seems to me that the market didn’t exactly take off with the recent wonderful jobs report…
That's just the start. Wait another 2 years.
-
@LuFins-Dad said in Bidenomics:
It seems to me that the market didn’t exactly take off with the recent wonderful jobs report…
That's just the start. Wait another 2 years.
@Aqua-Letifer said in Bidenomics:
@LuFins-Dad said in Bidenomics:
It seems to me that the market didn’t exactly take off with the recent wonderful jobs report…
That's just the start. Wait another 2 years.
For various reasons, I think you're right. Aside from the judges, particularly SCOTUS , wouldn't hurt my feelings tremendously if Trump lost this election.
Which may be why the Dems seem to be leaving Biden in there.
-
@Aqua-Letifer said in Bidenomics:
@LuFins-Dad said in Bidenomics:
It seems to me that the market didn’t exactly take off with the recent wonderful jobs report…
That's just the start. Wait another 2 years.
For various reasons, I think you're right. Aside from the judges, particularly SCOTUS , wouldn't hurt my feelings tremendously if Trump lost this election.
Which may be why the Dems seem to be leaving Biden in there.
@Jolly said in Bidenomics:
@Aqua-Letifer said in Bidenomics:
@LuFins-Dad said in Bidenomics:
It seems to me that the market didn’t exactly take off with the recent wonderful jobs report…
That's just the start. Wait another 2 years.
For various reasons, I think you're right. Aside from the judges, particularly SCOTUS , wouldn't hurt my feelings tremendously if Trump lost this election.
Which may be why the Dems seem to be leaving Biden in there.
Yeah, I'd love to be wrong and hope I am. But I don't see any evidence for that yet.
-
So you guys are suggesting that kicking the can down the road for decades, then coupled with an unprecedented influx of cash into the M1, along with incredible inflation over the last few years, interest rates that are twice what they were 4 years ago, and a workforce that is not growing manufacturing jobs, but is increasing government and part-time employment at incredible rates could ultimately have a negative outcome?
-
When does Social Security become insolvent?
-
The economy is artificially pumped up and we will have to pay the piper. Plus, Biden lies a lot.
-
Jobless claims are stable.
Calling the state of the U.S. jobs market these days stable seems like an understatement considering the latest data coming out of the Labor Department.
That’s because most of the past several weeks have shown that first-time claims for unemployment benefits haven’t fluctuated at all — as in zero.
For five of the past six weeks, the level of initial jobless filings totaled exactly 212,000. Given a labor force that is 168 million strong, achieving such stasis seems at least unusual if not uncanny, yet that is what the figures released each Thursday morning since mid-March have shown.
The consistency has raised a few eyebrows on Wall Street. The only week that varied was March 30, with 222,000.
“How is this statistically possible? Five of the last six weeks, the exact same number,” market veteran Jim Bianco, head of Bianco Research, posted Thursday on X.
“Initial claims for unemployment insurance are state programs, with 50 state rules, hundreds of offices, and 50 websites to file. Weather, seasonality, holidays, and economic vibrations drive the number of people filing claims from week to week,” he added. “Yet this measure is so stable that it does not vary by even 1,000 applications a week.”
Why, it's almost as though...nah.
-
https://www.cnbc.com/2024/04/25/stock-markets-today-live-updates.html
Unexpectedly, of course.
U.S. gross domestic product expanded 1.6% in the first quarter, the Bureau of Economic Analysis said. Economists polled by Dow Jones forecast GDP growth would come in at 2.4%.
Along with the downbeat growth rate for the quarter, the report showed consumer prices increased at a 3.4% pace, well above the previous quarter’s 1.8% advance. This raised concern over persistent inflation and put into question whether the Federal Reserve will be able to cut rates anytime soon.
“In the short term, the numbers don’t appear to be a green light for either bulls or bears, but if the initial reaction of stock index futures is any indication, the uncertainty is unlikely to ease pressures in a market experiencing its deepest pullback since last year,” said Chris Larkin, managing director of trading and investing at E*Trade from Morgan Stanley.
Following the GDP print, traders moved down expectations for an easing of Federal Reserve monetary policy. Traders now forecast just one interest rate cut this year, according to the CME FedWatch Tool.
The lackluster GDP added further pressure to an already-tense market contending with concerns over a pullback in growth among technology earnings.
Meta plunged 15% in premarket trading after the social media giant issued light revenue guidance for the second quarter. That would be the stock’s biggest one-day decline since October 2022. International Business Machines also fell 8% after missing consensus estimates for first-quarter revenue.
-
Delayed rate cut? We might see another hike!
-
Delayed rate cut? We might see another hike!
@LuFins-Dad said in Bidenomics:
Delayed rate cut? We might see another hike!
Not until end of the year, after the election.
-
https://www.cnn.com/2024/05/05/business/retailers-cutting-prices/index.html
CNN reports that consumers, even the high-income ones, are becoming more budget conscious. Retailers are marking down prices for items deemed "discretionary spending."
-
https://amp.cnn.com/cnn/2024/05/17/markets/dow-closes-above-40-000
The Dow Jones Industrial Average index closed above 40,000.
-
https://amp.cnn.com/cnn/2024/05/17/markets/dow-closes-above-40-000
The Dow Jones Industrial Average index closed above 40,000.
@Axtremus said in Bidenomics:
https://amp.cnn.com/cnn/2024/05/17/markets/dow-closes-above-40-000
The Dow Jones Industrial Average index closed above 40,000.
Joe still has 8 months to catch the red man's gains.

-
Congressional Budget Office's new report:
https://www.cbo.gov/publication/60166?mod=ANLink
A new report from the Congressional Budget Office released this week shows that inflation may have had less of an impact on households’ bottom lines than months of sticker shock on everything from Big Macs to daycare might suggest.
.
The agency’s analysis took a look at a typical household’s 2019 “consumption bundle”: the goods and services representing a year’s worth of purchases pre-pandemic.
.
Then, researchers analyzed how much households would pay for that same consumption bundle in 2023 prices, and how much their income rose or fell over the same period.
.
On average, purchasing power for households increased over that period, the agency found.
.
“By CBO’s estimate, aggregate income grew more than prices did between 2019 and 2023,” the report states.
...
The portion of household income required to purchase the same bundle of goods and services decreased by 2% for the lowest-earning quintile of households, and by 6.3% for those in the top group. -
Snort… this ought to be good…
-
Snort… this ought to be good…
