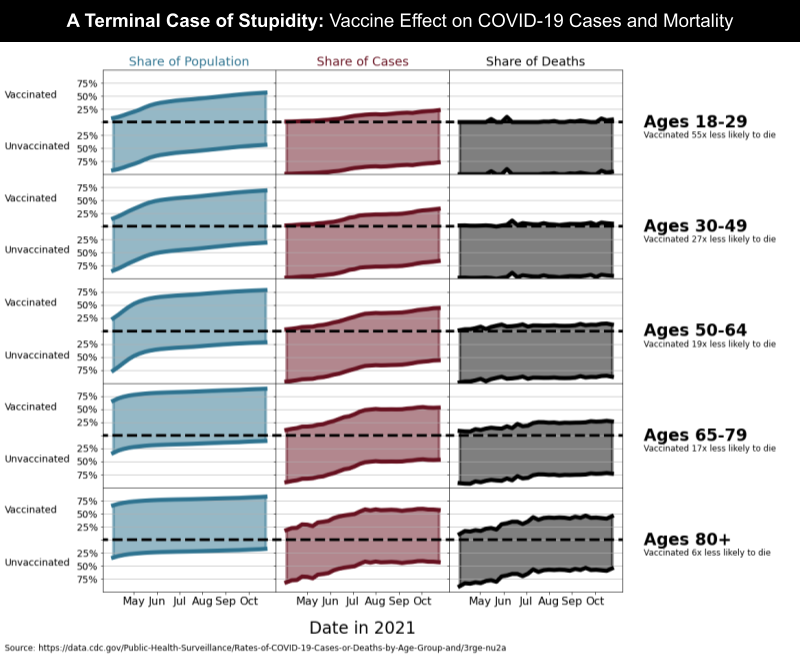
Visual: Vaccine Effect by Population, Cases, Deaths
-
Is that one shot, two shots, three shots or four shots?
BTW, new variant in Israel. 20 cases, so far. Supposedly, more variations than Omicron. Don't know the vaxxed status of the people who have this new sub-type.
-
Is that one shot, two shots, three shots or four shots?
BTW, new variant in Israel. 20 cases, so far. Supposedly, more variations than Omicron. Don't know the vaxxed status of the people who have this new sub-type.
@jolly At least 20 cases of Omicron sub-variant BA2 detected in Israel
Health Ministry says ‘no evidence’ new strain behaves differently from Omicron -
The immune system has less robustness with age, add to that the greater percentage of people who may have compromised immunity, eg cancer, diabetes, etc…and u get a lower vaccine efficacy.
-
Would love to see this visual with the recent Omicron months added in. Anecdotally, I know WAY more friends/family who have gotten COVID in the last month. All vaccinated, so they are fine, but still...
@89th said in Visual: Vaccine Effect by Population, Cases, Deaths:
Would love to see this visual with the recent Omicron months added in. Anecdotally, I know WAY more friends/family who have gotten COVID in the last month. All vaccinated, so they are fine, but still...
Anecdotally, I know way more friends and family that have gotten COVID in the last month. Some were vaccinated some weren’t, so all are fine because most cases are mild even before Omicron and even before the vaccine, but still…
The first problem the graphic above is that there aren’t any graphics showing obesity, diabetes, etc…
The second problem is that the source of the graphics are the CDC which have shown that they are perfectly willing to ignore numbers that aren’t conducive to the plan.
The Brad
-
@xenon said in Visual: Vaccine Effect by Population, Cases, Deaths:
Pretty good visual on how vaccination affects transmission and deaths.
Yes, I agree. Good visualization and definitely puts things into perspective.
-
@89th said in Visual: Vaccine Effect by Population, Cases, Deaths:
Would love to see this visual with the recent Omicron months added in. Anecdotally, I know WAY more friends/family who have gotten COVID in the last month. All vaccinated, so they are fine, but still...
Anecdotally, I know way more friends and family that have gotten COVID in the last month. Some were vaccinated some weren’t, so all are fine because most cases are mild even before Omicron and even before the vaccine, but still…
The first problem the graphic above is that there aren’t any graphics showing obesity, diabetes, etc…
The second problem is that the source of the graphics are the CDC which have shown that they are perfectly willing to ignore numbers that aren’t conducive to the plan.
@lufins-dad said in Visual: Vaccine Effect by Population, Cases, Deaths:
@89th said in Visual: Vaccine Effect by Population, Cases, Deaths:
Would love to see this visual with the recent Omicron months added in. Anecdotally, I know WAY more friends/family who have gotten COVID in the last month. All vaccinated, so they are fine, but still...
Anecdotally, I know way more friends and family that have gotten COVID in the last month. Some were vaccinated some weren’t, so all are fine because most cases are mild even before Omicron and even before the vaccine, but still…
The first problem the graphic above is that there aren’t any graphics showing obesity, diabetes, etc…
The second problem is that the source of the graphics are the CDC which have shown that they are perfectly willing to ignore numbers that aren’t conducive to the plan.
Fair enough, but you can't discredit data by pointing to an absence of better data.
Hello! It looks like you're interested in this conversation, but you don't have an account yet.
Getting fed up of having to scroll through the same posts each visit? When you register for an account, you'll always come back to exactly where you were before, and choose to be notified of new replies (either via email, or push notification). You'll also be able to save bookmarks and upvote posts to show your appreciation to other community members.
With your input, this post could be even better 💗
Register Login