State level stats
-
This is my weekly continuation of the 'NY is Ground Zero thread. I switched to weekly because I'm lazy and also you get better trend info without the added noise of day-of-the-week variation. And since it's once per week I'll do a bit more analysis.
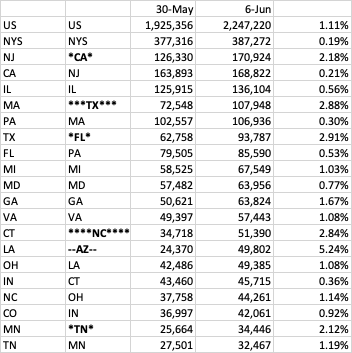
Here's the top 20 by case count. Only change is Minnesota came from out of the top 20 into 19th place, leapfrogging (see what I did there Brenda?) Tennessee and knocking Washington state down to 21.
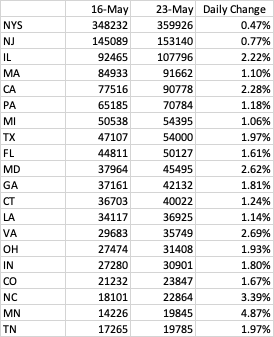
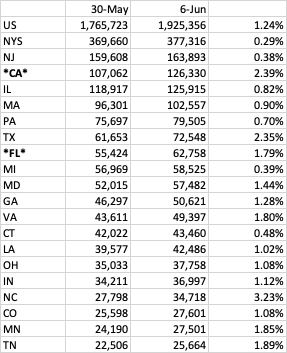
So now, of those top 20 states by case count, how are their growth rates doing? Again that's a daily compound growth rate.
Last week VA was in the lead.
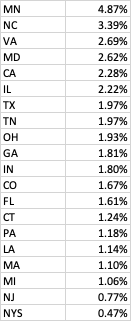
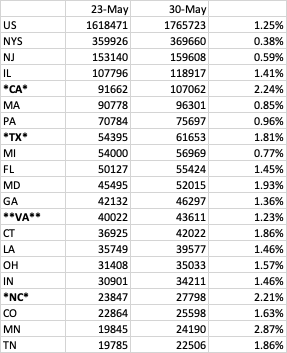
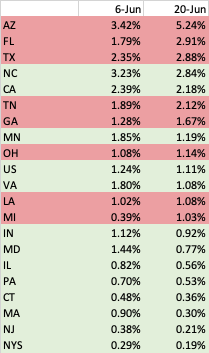
Here's the week-to-week change. So the number on the left is the compound daily change rate for the week ending 5/16, on the right the compound daily change rate for the week ending 5/23. Most states' growth rates are decreasing (green), however three are increasing (red).
-
For what it's worth, NC's Phase 1 of reopening was Friday. Today was their highest ever new case count.
@jon-nyc said in State level stats:
For what it's worth
Probably not much...
NC's Phase 1 of reopening was Friday. Today was their highest ever new case count.
With increased testing, of course you're going to be seeing a higher number of cases.
With (presumably) a two week incubation period, is it fair to imply (as you seem to do) that the increase in case count today is because of the reopening yesterday?
-
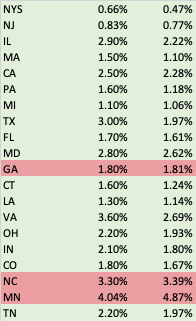
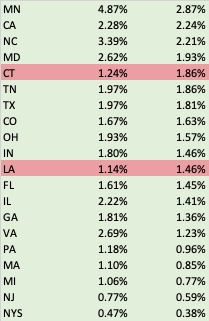
States sorted by growth rates. (daily compound growth rates of total cases). Red means the growth rate is increasing, green decreasing.
Note this is only the top 20 states by case count, so some state with a lower number of total cases could well be growing faster.
-
As the rate of testing improves, I'd expect to see more positive cases. However, I'm not sure about the disparity between various states. California was touted as an example of how it should be done, and now....
Is there a site where one can see the CFR over time? Perhaps the # of "serious" infections? That would be an interesting metric. If those numbers are falling, despite an increase in the absolute number of positive cases, it might give a better insight on how things are going.
-
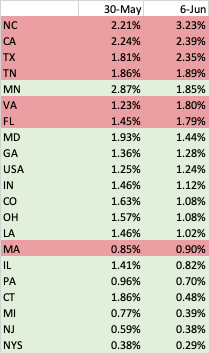
I didn't post this last Saturday, so this is comparing the daily growth rates over the last 14 days to the daily growth rates of the previous 7. Still a daily growth rate, so the comparison is apples to apples.
So CA and FL and TN went up a notch, Texas went up 3, NC went up 4, and AZ went from not in the top 20 to number 14.
Hello! It looks like you're interested in this conversation, but you don't have an account yet.
Getting fed up of having to scroll through the same posts each visit? When you register for an account, you'll always come back to exactly where you were before, and choose to be notified of new replies (either via email, or push notification). You'll also be able to save bookmarks and upvote posts to show your appreciation to other community members.
With your input, this post could be even better 💗
Register Login