Bidenomics At Work
-

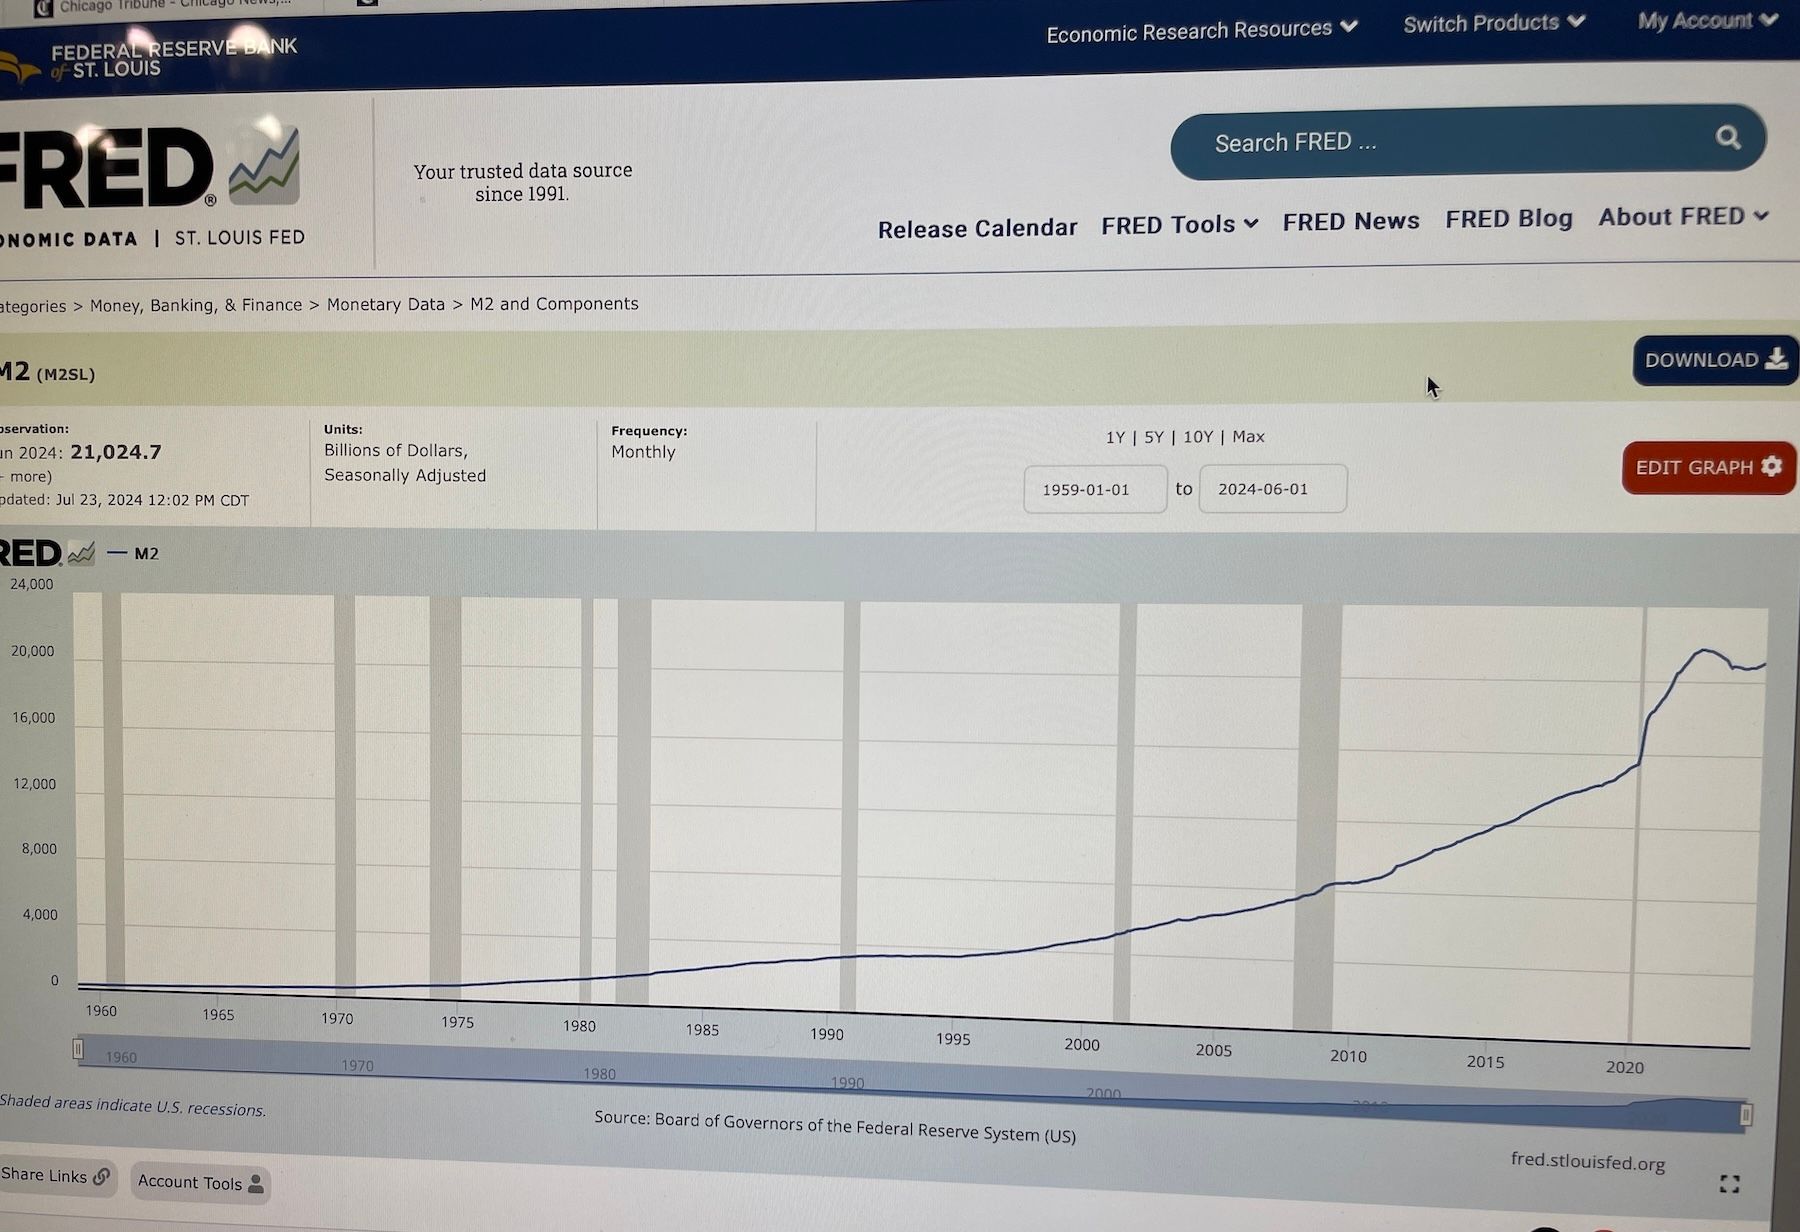
Money Supply
Jan 2017. $13.2
Jan 2021. $19.3
%change = 46.2%Jan 2021. $19.3
Jul 2024. $21.0
%change = 8.8%I am not an economist but I would hazard a guess that the period from Jan 2017-Jan 2021 had a larger impact on the economy (inflation, interest rates) than the period from Jan 2021 - Jul 2024.
The US economy is like a huge ship. You can start to turn the "ship" but it takes a long long time to make that turn.
That is why I have say many many times before. The president gets too much credit and too much blame because people only look at their term as if economic things that happen before and after their time have nothing to do with them.
-
Indeed. The traditional conservative view of inflation would peg this clearly on the increase of the money supply in the spring of 2020. Precisely as Milton Friedman’s theory predicted, inflation increased dramatically 18 months later.
In sober moments Jolly admits this and makes weak noises about the perception of the electorate.
-
Intel announces huge layoff:
https://www.washingtonpost.com/technology/2024/08/01/intel-layoffs-chips/
15,000 jobs; 15% of its workforce.
Biden has big plans to boost semiconductor manufacturing in the USA. The Chips and Science Act of 2022 allocates $52 billion in grants and $75 billion in loans to support the domestic chip industry. As the sole large scale semiconductor manufacturer left in the USA, Intel is expected to be the largest beneficiary of this. But none of the money has been released to Intel yet (still stuck in "due diligence").
But Intel has already missed the boat for smartphones and tablets (Arm wins this sector), NVIDIA is winning the AI chip race, and AMD is eating more and more of Intel's PC lunch. :man-shrugging:
-
@jon-nyc said in Bidenomics At Work:
We’re setting oil production records under Biden.
U.S. oil production is forecast to average an all-time high of 12.8 million barrels a day this year and keep growing to 13.1 million in 2024, the federal Energy Information Administration said in its latest forecast. That’s up from the most recent trough of 5 million barrels a day in 2008, and probably enough to help the U.S. to keep its title as the No. 1 global crude oil producer.
But what about federal lands?
In fact, though, oil production from federal lands and waters has risen on Biden’s watch, reaching past 3 million barrels per day last year. The high mark during President Donald Trump’s term was 2.75 million barrels a day.
And record production continues. Gosh darn President Biden!!!!
https://energynow.com/2024/03/u-s-leads-global-oil-production-for-sixth-straight-year-eia/
U.S. crude oil production lead global oil production for a sixth straight year, with a record breaking average production of 12.9 million barrels per day (bpd), the Energy Information Administration (EIA) said in a release on Monday.
In December, U.S. crude oil production hit a new monthly record high of over 13.3 million bpd, the agency said.
“The United States produced more crude oil than any nation at any time, according to our International Energy Statistics, for the past six years in a row,” the EIA added.
The EIA says it is unlikely that the record will be broken by another country in the near term.
@taiwan_girl said in Bidenomics At Work:
@jon-nyc said in Bidenomics At Work:
We’re setting oil production records under Biden.
U.S. oil production is forecast to average an all-time high of 12.8 million barrels a day this year and keep growing to 13.1 million in 2024, the federal Energy Information Administration said in its latest forecast. That’s up from the most recent trough of 5 million barrels a day in 2008, and probably enough to help the U.S. to keep its title as the No. 1 global crude oil producer.
But what about federal lands?
In fact, though, oil production from federal lands and waters has risen on Biden’s watch, reaching past 3 million barrels per day last year. The high mark during President Donald Trump’s term was 2.75 million barrels a day.
And record production continues. Gosh darn President Biden!!!!
https://energynow.com/2024/03/u-s-leads-global-oil-production-for-sixth-straight-year-eia/
U.S. crude oil production lead global oil production for a sixth straight year, with a record breaking average production of 12.9 million barrels per day (bpd), the Energy Information Administration (EIA) said in a release on Monday.
In December, U.S. crude oil production hit a new monthly record high of over 13.3 million bpd, the agency said.
“The United States produced more crude oil than any nation at any time, according to our International Energy Statistics, for the past six years in a row,” the EIA added.
The EIA says it is unlikely that the record will be broken by another country in the near term.
And again another record production of oil!!
In case you missed it, the U.S. Energy Information Administration (EIA) reported Thursday that domestic oil and gas producers set another new record high in oil production during the week ended August 4. U.S. producers pumped out an amazing 13.4 million barrels per day (bpd) for the week, an increase of 800,000 bpd from the same week a year ago. This latest record represents the highest level of oil ever produced by any nation on earth.
and
Over the last 44 months, the industry has managed to grow U.S. oil production by 2.3 million bpd
If I do the math correctly, that is about a 30% increase in production during President Biden term when compared to President Trump.
-
In the real world, we would say Biden-Harris have been cooking the books.
Wonder how much effect this has on TG's beloved charts?
@Jolly said in Bidenomics At Work:
In the real world, we would say Biden-Harris have been cooking the books.
Wonder how much effect this has on TG's beloved charts?
If they were "cooking the books", why would they release revised numbers now? If it was something that the politicians had control over, releasing it at this time would point to the Republicans. LOL
About your second question. No difference. I am still waiting for someone to offer "measurable" proof that there are certain things that are consistently better under a Republic or Democrat president. :couple_with_heart:
-
-
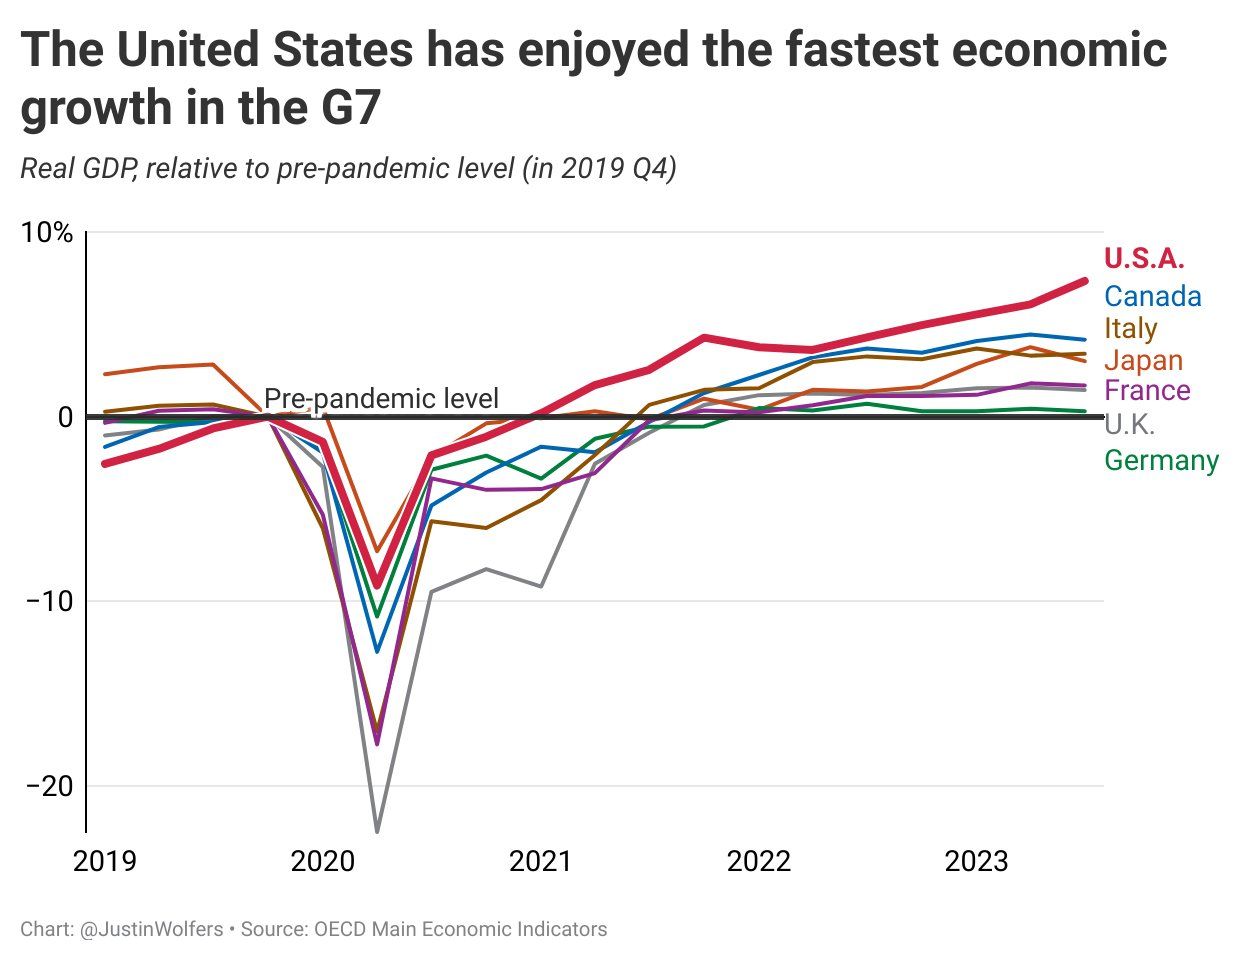
Who are you going to listen to, the OECD or some stoner on YouTube?
-
-
Now excuse me while I make an emergency withdrawal from my 401K
-
- Nonfarm payrolls increase by 254,000 in September
- Unemployment rate falls to 4.1% from 4.2%
- Average hourly earnings rise 0.4%; up 4.0% year-on-year
- Average workweek slips to 34.2 hours from 34.3 hours
-
- Nonfarm payrolls increase by 254,000 in September
- Unemployment rate falls to 4.1% from 4.2%
- Average hourly earnings rise 0.4%; up 4.0% year-on-year
- Average workweek slips to 34.2 hours from 34.3 hours
@Axtremus said in Bidenomics At Work:
- Nonfarm payrolls increase by 254,000 in September
- Unemployment rate falls to 4.1% from 4.2%
- Average hourly earnings rise 0.4%; up 4.0% year-on-year
- Average workweek slips to 34.2 hours from 34.3 hours
I'll wait until after November when they adjust the numbers to pass judgement...
-
Thank you, Brian J Foley, for pointing out that the nearly 1,000,000 jobs revised downward is less than 1% of the total number of jobs. Your 1 follower has truly been blessed by your wisdom.
