Skip to content
  • Categories
  • Recent
  • Tags
  • Popular
  • Users
  • Groups
Skins
  • Light
  • Cerulean
  • Cosmo
  • Flatly
  • Journal
  • Litera
  • Lumen
  • Lux
  • Materia
  • Minty
  • Morph
  • Pulse
  • Sandstone
  • Simplex
  • Sketchy
  • Spacelab
  • United
  • Yeti
  • Zephyr
  • Dark
  • Cyborg
  • Darkly
  • Quartz
  • Slate
  • Solar
  • Superhero
  • Vapor

  • Default (No Skin)
  • No Skin
Collapse

The New Coffee Room

  1. TNCR
  2. General Discussion
  3. Hay, Excel Masters!

Hay, Excel Masters!

Scheduled Pinned Locked Moved General Discussion
24 Posts 7 Posters 152 Views
  • Oldest to Newest
  • Newest to Oldest
  • Most Votes
Reply
  • Reply as topic
Log in to reply
This topic has been deleted. Only users with topic management privileges can see it.
  • HoraceH Online
    HoraceH Online
    Horace
    wrote on last edited by
    #12

    you could also make formulas in a hidden away part of the sheet where cell J2 is "=A2", copy that down to J8, then J9 is "=D2", copy that down to J15. Similar for the other column of data, then build your charts from your out-of-the-way columns

    Education is extremely important.

    1 Reply Last reply
    • 89th8 Offline
      89th8 Offline
      89th
      wrote on last edited by
      #13

      It would help to know what these values represent. Views of TNCR? Trips to the liquor store?

      George KG 1 Reply Last reply
      • HoraceH Online
        HoraceH Online
        Horace
        wrote on last edited by
        #14

        I think it's where he keeps his passwords.

        Education is extremely important.

        1 Reply Last reply
        • 89th8 89th

          It would help to know what these values represent. Views of TNCR? Trips to the liquor store?

          George KG Offline
          George KG Offline
          George K
          wrote on last edited by
          #15

          @89th said in Hay, Excel Masters!:

          It would help to know what these values represent. Views of TNCR? Trips to the liquor store?

          Dates and dollars

          "Now look here, you Baltic gas passer... " - Mik, 6/14/08

          The saying, "Lite is just one damn thing after another," is a gross understatement. The damn things overlap.

          Doctor PhibesD 1 Reply Last reply
          • George KG Offline
            George KG Offline
            George K
            wrote on last edited by
            #16

            Chat GPT has a long answer. I'll play with it later.

            "How can I add two non-contiguous columns into one line chart in excel. Please provide an example.

            "Now look here, you Baltic gas passer... " - Mik, 6/14/08

            The saying, "Lite is just one damn thing after another," is a gross understatement. The damn things overlap.

            1 Reply Last reply
            • George KG Offline
              George KG Offline
              George K
              wrote on last edited by
              #17

              1 Prepare Your Data: Make sure your data is organized in columns. For example, let's say you have the following data:
yamlCopy code

A B C
              2 1 Date Sales Expenses
              3 2 01/01/2023 1000 500
              4 3 02/01/2023 1500 700
              5 4 03/01/2023 1300 600
              6 5 04/01/2023 1700 800
              7 


              8 Select the First Data Series:
              ◦ Click and drag to select the first column of data, including the headers (e.g., A1:A5 and B1:B5).
              9 Create the Initial Line Chart:
              ◦ Go to the Insert tab on the Ribbon.
              ◦ Click on the Line Chart icon in the Charts group, and select the desired line chart type (e.g., "Line" or "Line with Markers").
              ◦ Excel will create a line chart based on your selected data.
              10 Add the Second Data Series:
              ◦ Right-click on the chart and select Select Data.
              ◦ In the Select Data Source dialog box, click the Add button to add a new series.
              ◦ In the Edit Series dialog box:
              ▪ Series name: Select the header of the second data column (e.g., C1).
              ▪ Series values: Select the data range for the second column (e.g., C2:C5).
              11 Edit Horizontal Axis Labels (if needed):
              ◦ In the Select Data Source dialog box, you might need to edit the horizontal axis labels if they are not correct.
              ◦ Click the Edit button under Horizontal (Category) Axis Labels.
              ◦ Select the range for your date labels (e.g., A2:A5).
              12 Format the Chart:
              ◦ You can format the chart as needed by right-clicking on different elements of the chart and choosing the appropriate formatting options.
              ◦ You can change the chart title, axis titles, legend, and other formatting options to make your chart more readable and presentable.
              Example Walkthrough:
              Given the following data in your Excel sheet:

              A
              B
              C
              1
              Date
              Sales
              Expenses
              2
              01/01/2023
              1000
              500
              3
              02/01/2023
              1500
              700
              4
              03/01/2023
              1300
              600
              5
              04/01/2023
              1700
              800
              1 Select Data for Sales: Highlight cells A1:A5 and B1:B5.
              2 Insert Line Chart:
              ◦ Go to Insert > Line Chart and choose the type of line chart.
              3 Add Data for Expenses:
              ◦ Right-click on the chart and select Select Data.
              ◦ Click Add.
              ◦ In the Edit Series dialog:
              ▪ Series name: Select cell C1.
              ▪ Series values: Select cells C2:C5.
              4 Edit Axis Labels (if necessary):
              ◦ In the Select Data Source dialog, under Horizontal (Category) Axis Labels, click Edit.
              ◦ Select the range A2:A5.
              Now you should have a line chart that shows both Sales and Expenses over time.

              "Now look here, you Baltic gas passer... " - Mik, 6/14/08

              The saying, "Lite is just one damn thing after another," is a gross understatement. The damn things overlap.

              1 Reply Last reply
              • George KG George K

                @89th said in Hay, Excel Masters!:

                It would help to know what these values represent. Views of TNCR? Trips to the liquor store?

                Dates and dollars

                Doctor PhibesD Offline
                Doctor PhibesD Offline
                Doctor Phibes
                wrote on last edited by
                #18

                @George-K said in Hay, Excel Masters!:

                Dates and dollars

                You're a cheap date!

                I was only joking

                George KG 1 Reply Last reply
                • Doctor PhibesD Doctor Phibes

                  @George-K said in Hay, Excel Masters!:

                  Dates and dollars

                  You're a cheap date!

                  George KG Offline
                  George KG Offline
                  George K
                  wrote on last edited by
                  #19

                  @Doctor-Phibes said in Hay, Excel Masters!:

                  You're a cheap date!

                  I'm by myself....

                  "Now look here, you Baltic gas passer... " - Mik, 6/14/08

                  The saying, "Lite is just one damn thing after another," is a gross understatement. The damn things overlap.

                  1 Reply Last reply
                  • P Offline
                    P Offline
                    Pablo
                    wrote on last edited by
                    #20

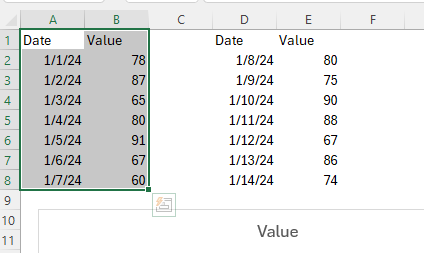
                    Ok, here are the steps I'd take. More details this time.

                    Steps:

                    1. Select data in Columns A:B as shown.

                    2d386de6-3e3f-42ed-a226-0abbb9c4d63e-image.png

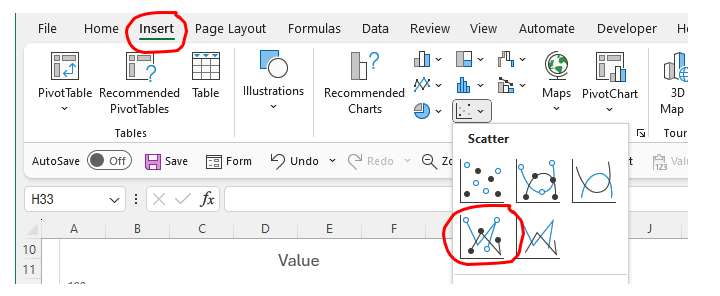
                    1. In the Excel "Insert" ribbon, select chart type "X-Y Scatter". This will create an (X,Y) plot with the first data series as shown below.
                    b3e7e088-3e5e-4d22-9fd3-eed3b5bc759b-image.png

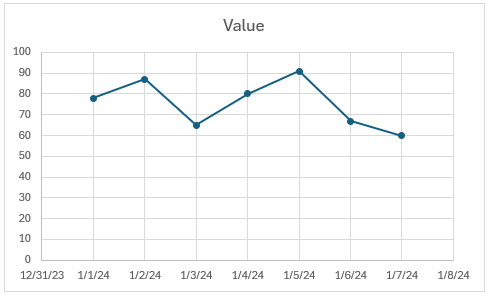
                    1. You should now have a plot that looks something like this:
                      afcb8336-3c93-49e2-b3c8-3bcd36ae6148-image.png

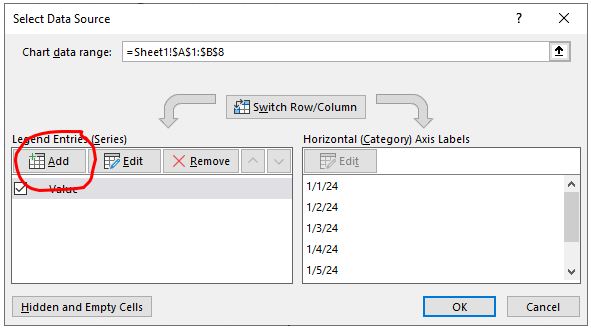
                    2. RIGHT-click on the chart -> Select Data.
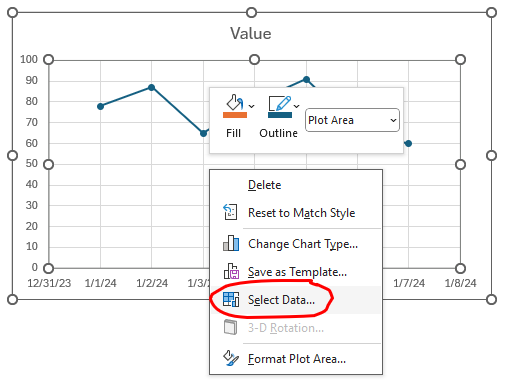
                    fa75a8ed-a9bb-4745-ac85-5b1155b32b13-image.png

                    1. Select Add

                    b3ecae0f-88b2-4528-aae1-ebdaec9dad3a-image.png

                    1. Select X data (green shaded) for Series X Values, and Y data (pink shaded) for Series Y Values.
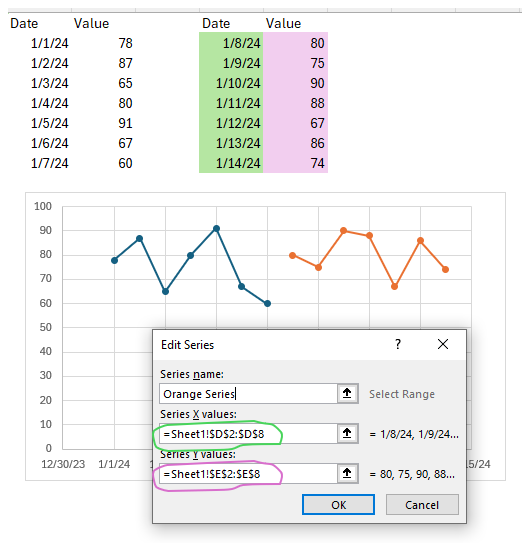
                      352c87bb-1b8a-4682-9b31-d5f4b10136f7-image.png

                    2. You can format the lines to be the same if you want.

                    The only thing I don't know how to address with this method is that the two series will not be connected (end of the first series joined to start of second series). Not sure if that's a problem for you or not.

                    Good luck.

                    1 Reply Last reply
                    • HoraceH Online
                      HoraceH Online
                      Horace
                      wrote on last edited by
                      #21

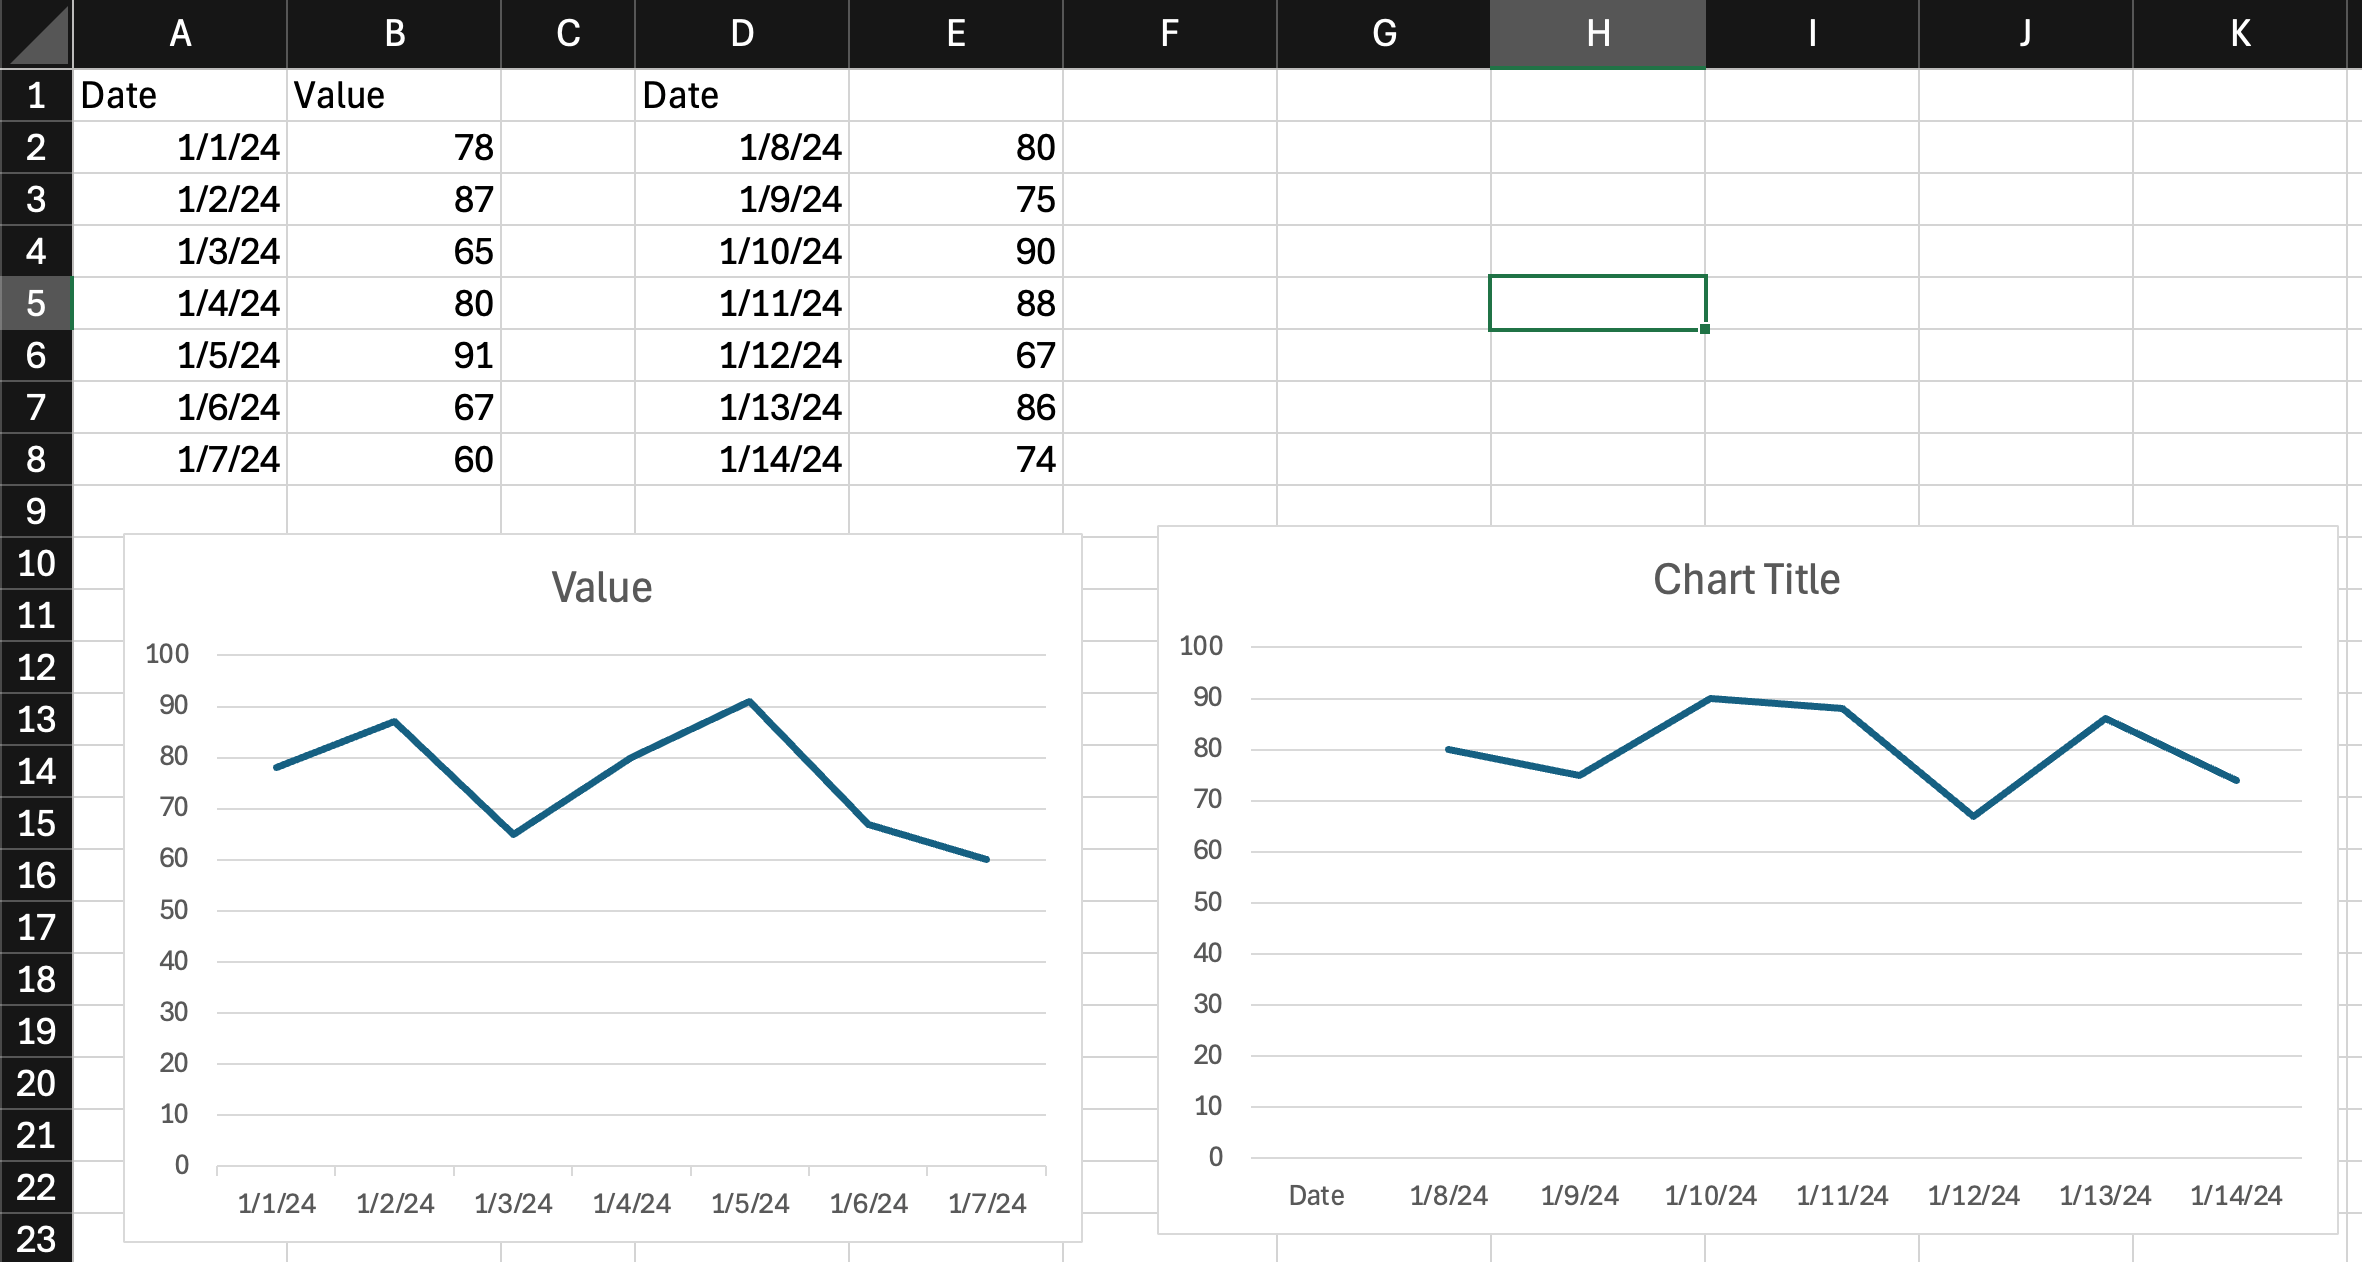
                      My suggestion actually solves all of George's stated issues.

                      I consider it deeply humbling to have provided a solution that is at least on par with, if not better than, Pablo's.

                      Pablo, it has been an honor to collaborate with you on this project.

                      Now, when people speak of Excel masters, maybe, after giving Pablo his richly deserved due, they will also mention my name.
                      Education is extremely important.

                      1 Reply Last reply
                      • George KG Offline
                        George KG Offline
                        George K
                        wrote on last edited by
                        #22

                        I was able to follow ChatGPT's suggestion and it all worked.

                        "Now look here, you Baltic gas passer... " - Mik, 6/14/08

                        The saying, "Lite is just one damn thing after another," is a gross understatement. The damn things overlap.

                        HoraceH 1 Reply Last reply
                        • P Offline
                          P Offline
                          Pablo
                          wrote on last edited by Pablo
                          #23

                          Touché, Horace. You are a gifted teacher and a fine social commentator/educator/influencer. The world is lucky that you're willing to share your wisdom with us. 😃

                          George, glad that you were able to get it to work.:male-doctor:

                          Pablo

                          1 Reply Last reply
                          • George KG George K

                            I was able to follow ChatGPT's suggestion and it all worked.

                            HoraceH Online
                            HoraceH Online
                            Horace
                            wrote on last edited by
                            #24

                            @George-K said in Hay, Excel Masters!:

                            I was able to follow ChatGPT's suggestion and it all worked.

                            Please don't interrupt us while we're discussing the brilliance of our solutions to your Excel problem.

                            Education is extremely important.

                            1 Reply Last reply
                            Reply
                            • Reply as topic
                            Log in to reply
                            • Oldest to Newest
                            • Newest to Oldest
                            • Most Votes


                            • Login

                            • Don't have an account? Register

                            • Login or register to search.
                            • First post
                              Last post
                            0
                            • Categories
                            • Recent
                            • Tags
                            • Popular
                            • Users
                            • Groups