NYC is ground zero
-
@jon-nyc said in NYC is ground zero:
11: GA - 32,162
12: LA - 30,855
13: MD - 30,485
14: IN - 23,146
15: OH - 23,016
16: VA - 22,342
17: CO - 18,371
18: WA - 16,231
19: TN - 14,452
20: NC - 13.953The above are #s 11-20 from 8 days ago. Thought I'd check in again to see how the rankings have changed.
(Percentages are compound DAILY growth rates.)
11: GA - 37,161 - 1.8%
12: CT - 36,703 - 1.6% (was in top 10 last week)
13: LA - 34,117 - 1.3%
14: VA - 29,683 - 3.6%
15: OH - 27,474 - 2.2%
16: IN - 27,280 - 2.1%
17: CO - 21,232 - 1.8%
18: NC - 18,101 - 3.3%
19: WA - 17,951 - 1.3%
20: TN - 17,265 - 2.2%NC and VA are the two that climbed in rankings (and MD, which is in top 10 now), and you can see their growth is a full % point or more above the others.
@jon-nyc said in NYC is ground zero:
11: GA - 37,161 - 1.8%
12: CT - 36,703 - 1.6% (was in top 10 last week)
13: LA - 34,117 - 1.3%
14: VA - 29,683 - 3.6%
15: OH - 27,474 - 2.2%
16: IN - 27,280 - 2.1%
17: CO - 21,232 - 1.8%
18: NC - 18,101 - 3.3%
19: WA - 17,951 - 1.3%
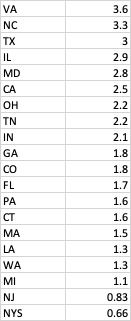
20: TN - 17,265 - 2.2%Thought it would be interesting to see how the top 10 have grown over that same 8 day period.
NYS - 0.66%
NJ - 0.83%
IL - 2.9%
MA - 1.5%
CA - 2.5%
PA - 1.6%
MI - 1.1%
TX - 3.0%
FL - 1.7%
MD - 2.8% -
-
Interesting to note Maryland's, considering that our stay-at-home order was lifted yesterday.
-
We’re #1!
@LuFins-Dad said in NYC is ground zero:
We’re #1!
Not according to the Virginia's government numbers
Maybe they are for a different timeframe or a different method of counting
But this chart shows a 7-day moving average of cases going consistently down since 5/1
https://www.vdh.virginia.gov/coronavirus/
 image url)
 -
What conflict do you see between the 8 day CDGR as it relates to the other 19 states and the data you posted?
-
What conflict do you see between the 8 day CDGR as it relates to the other 19 states and the data you posted?
Hello! It looks like you're interested in this conversation, but you don't have an account yet.
Getting fed up of having to scroll through the same posts each visit? When you register for an account, you'll always come back to exactly where you were before, and choose to be notified of new replies (either via email, or push notification). You'll also be able to save bookmarks and upvote posts to show your appreciation to other community members.
With your input, this post could be even better 💗
Register Login