"Handsome men are jerks"
-
For those who are not familiar with distributions visualized as in the first example:
The dots are individuals. Their x- and y-coordinates measure how handsome and how nice they are, respectively.
The "round" shape indicates that these properties are not correlated. The correlation is illustrated with the blue bar, which is computed to go through "the middle" of the dots.This is what correlation of such dot clouds looks like:
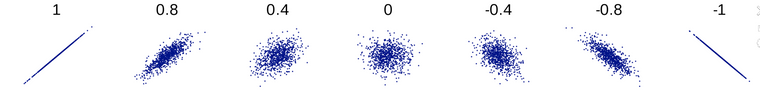
The middle shows "uncorrelated", as in our example. To the left, it shows more and more correlation. For instance, if you measure height and weight of people, you'd get a graph like the 0.8 one. To the right, we see more and more inverse correlation. For instance, if you'd measure HP vs MPG of engines, you'd get a picture like the -0.8 one.
The point of the "paradox" is that if you filter the population by two positive traits (you date men who are nice and hot), then in that subset there's an inverse correlation, as illustrated by the diagonal blue line on the right picture. It doesn't look as "clean" as the "-0.8" picture I posted above, but mathematically it is still clearly a negative correlation.
Hello! It looks like you're interested in this conversation, but you don't have an account yet.
Getting fed up of having to scroll through the same posts each visit? When you register for an account, you'll always come back to exactly where you were before, and choose to be notified of new replies (either via email, or push notification). You'll also be able to save bookmarks and upvote posts to show your appreciation to other community members.
With your input, this post could be even better 💗
Register Login