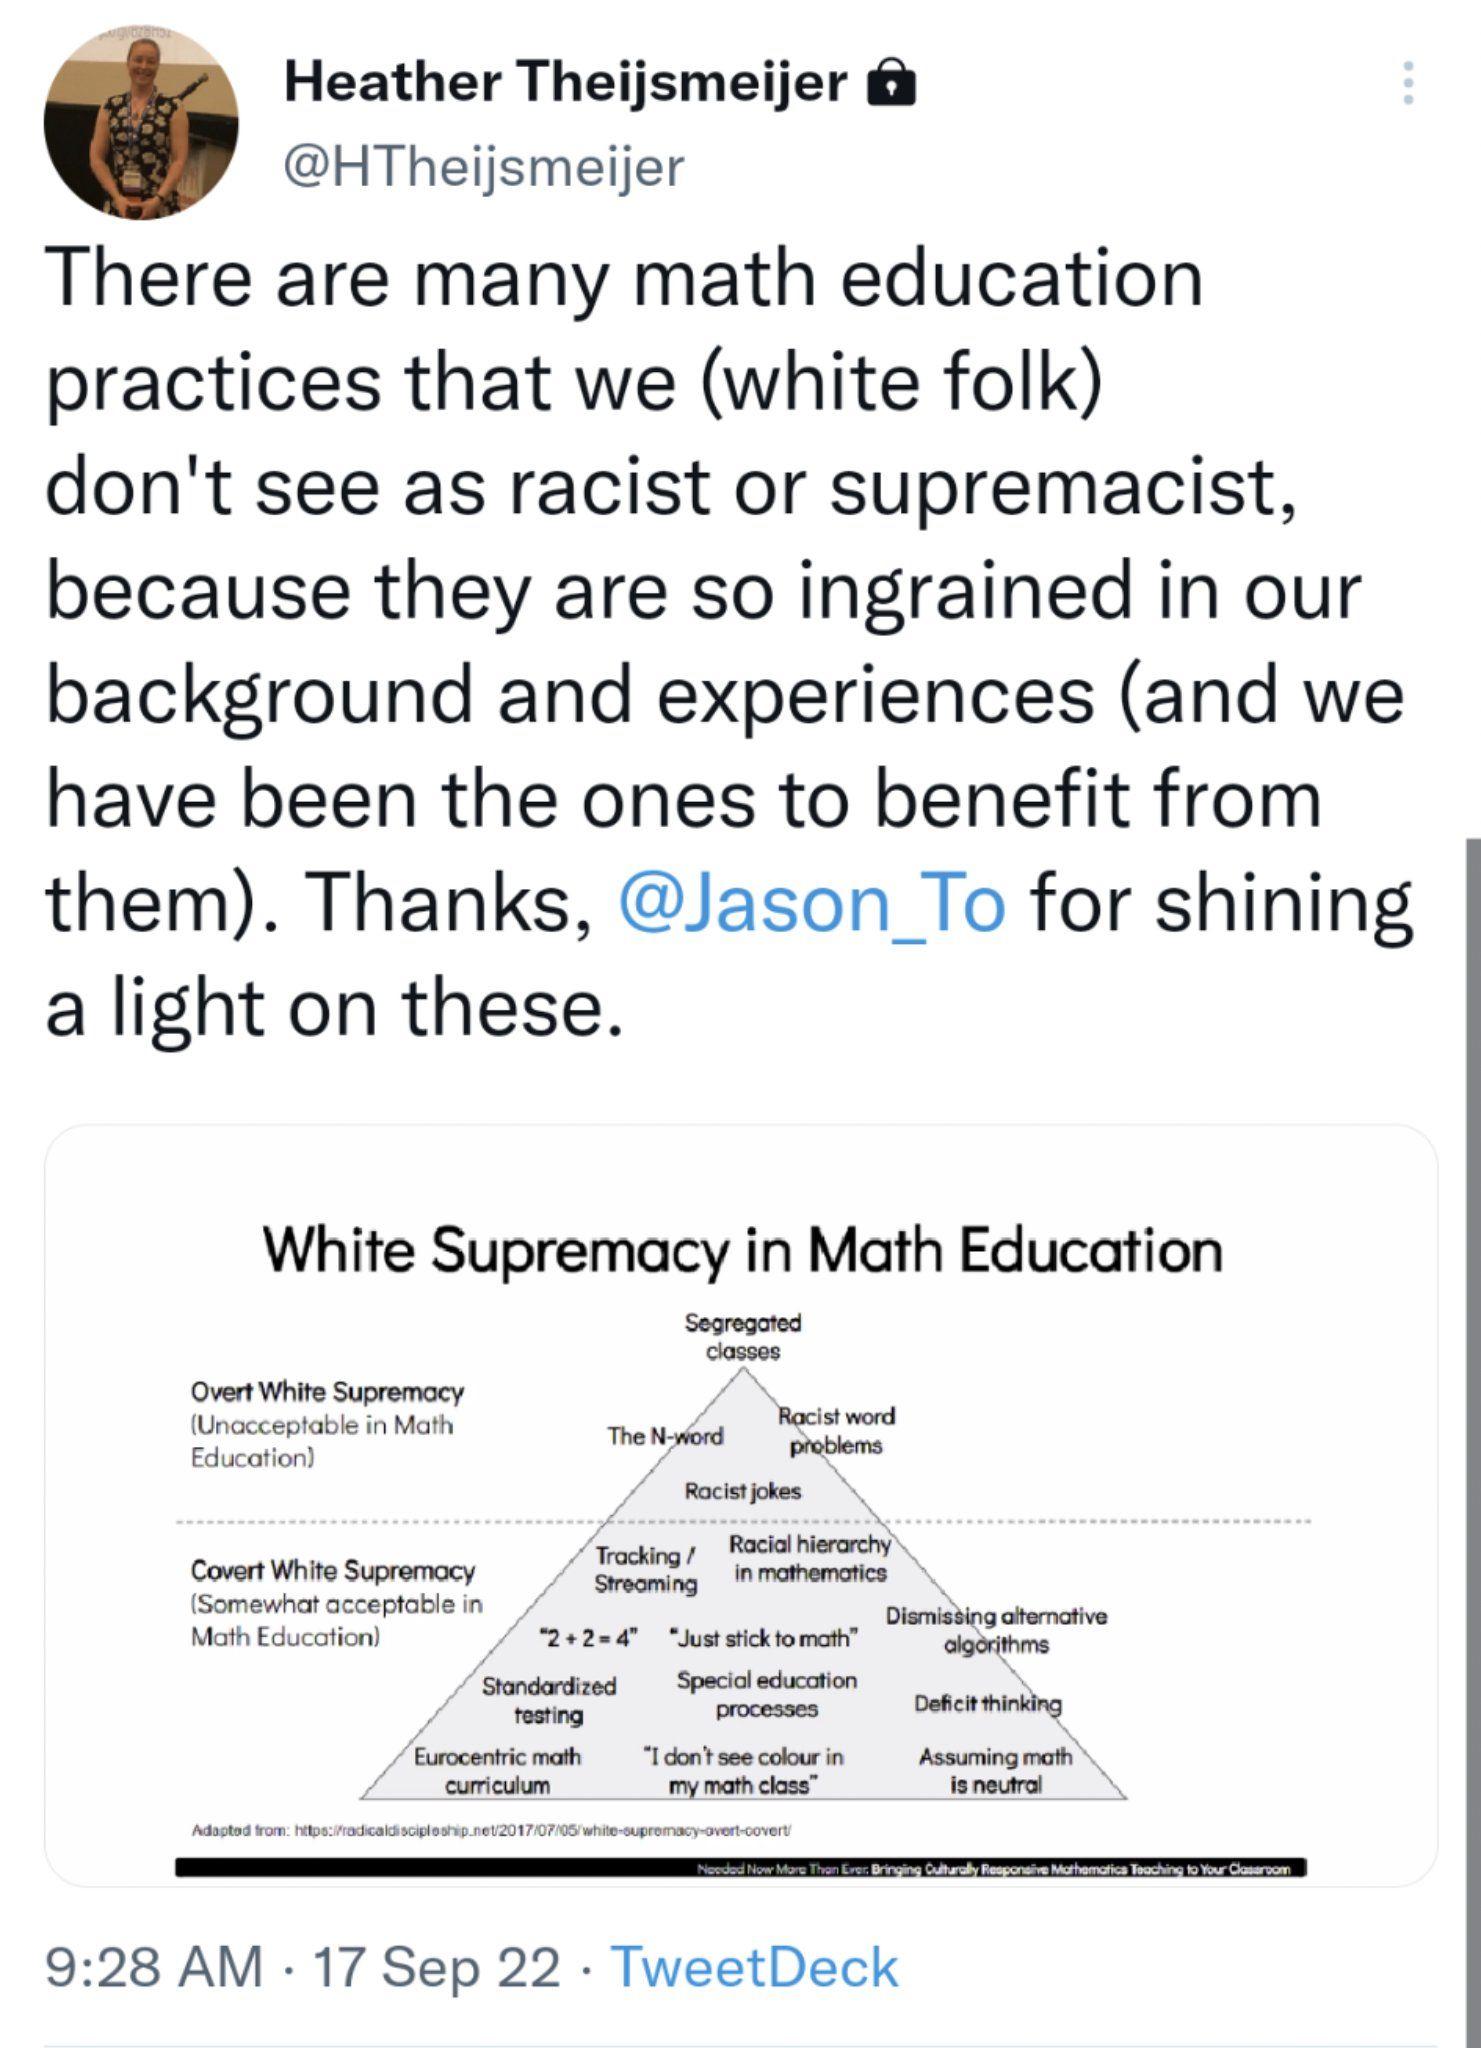
"Covert White Supremacy"
-
Rainbow District School Board Salaries
Teacher salaries - 1 salaries reported $76,233/yr
Teacher, Secondary School salaries - 1 salary reported $37,449/yr
Office Administrator salaries - 1 salaries reported $100,604/yr
IT Professional salaries - 1 salaries reported $80,970/yr@Catseye3 said in "Covert White Supremacy":
Rainbow District School Board Salaries
Teacher salaries - 1 salaries reported $76,233/yr
Teacher, Secondary School salaries - 1 salary reported $37,449/yr
Office Administrator salaries - 1 salaries reported $100,604/yr
IT Professional salaries - 1 salaries reported $80,970/yrRight. So why does this lady make $110K instead of $40K?
-
@Catseye3 said in "Covert White Supremacy":
Rainbow District School Board Salaries
Teacher salaries - 1 salaries reported $76,233/yr
Teacher, Secondary School salaries - 1 salary reported $37,449/yr
Office Administrator salaries - 1 salaries reported $100,604/yr
IT Professional salaries - 1 salaries reported $80,970/yrRight. So why does this lady make $110K instead of $40K?
@Klaus said in "Covert White Supremacy":
Right. So why does this lady make $110K instead of $40K?
Seems like that's around the average salary for that school district - its around Sudbury, in northern Ontario. Population about 125k, About 1.1% black, btw.
-
@Klaus said in "Covert White Supremacy":
Right. So why does this lady make $110K instead of $40K?
Seems like that's around the average salary for that school district - its around Sudbury, in northern Ontario. Population about 125k, About 1.1% black, btw.
-
I find it a hoot that she's lambasting white supremacy in a district that's 98% white.
C'mon down, sugar booger, to districts that are 60/40, 50/50 and majority minority
-
I find it a hoot that she's lambasting white supremacy in a district that's 98% white.
C'mon down, sugar booger, to districts that are 60/40, 50/50 and majority minority
-
@George-K said in "Covert White Supremacy":
@Jolly said in "Covert White Supremacy":
majority minority
Whatever the hell that mean, LOL.
That's a district, etc., where a usual minority has become a majority.
Some very interesting districts. Watch how they vote, allocate funds and treat the "minorities" in their district.
@Jolly said in "Covert White Supremacy":
@George-K said in "Covert White Supremacy":
@Jolly said in "Covert White Supremacy":
majority minority
Whatever the hell that mean, LOL.
That's a district, etc., where a usual minority has become a majority.
Some very interesting districts. Watch how they vote, allocate funds and treat the "minorities" in their district.
Care to expand on that a little, with citations if possible? I have a sneaking suspicion they aren't too charitable.
-
Come up with the answer you want, then develop the proof. It’s simple non-colonialization math!
The Brad
-
Come up with the answer you want, then develop the proof. It’s simple non-colonialization math!
@LuFins-Dad said in "Covert White Supremacy":
Come up with the answer you want, then develop the proof. It’s simple non-colonialization math!
Alternative math. It fits with the times.
-
Come up with the answer you want, then develop the proof. It’s simple non-colonialization math!
@LuFins-Dad said in "Covert White Supremacy":
Come up with the answer you want, then develop the proof. It’s simple non-colonialization math!
As I learned during my stint in academia: first draw your curve, then plot your points.
-
@LuFins-Dad said in "Covert White Supremacy":
Come up with the answer you want, then develop the proof. It’s simple non-colonialization math!
As I learned during my stint in academia: first draw your curve, then plot your points.
@George-K said in "Covert White Supremacy":
@LuFins-Dad said in "Covert White Supremacy":
Come up with the answer you want, then develop the proof. It’s simple non-colonialization math!
As I learned during my stint in academia: first draw your curve, then plot your points.
Politicians on the other hand start with a single data point, and use it to plot a 3-dimensional plane.
Hello! It looks like you're interested in this conversation, but you don't have an account yet.
Getting fed up of having to scroll through the same posts each visit? When you register for an account, you'll always come back to exactly where you were before, and choose to be notified of new replies (either via email, or push notification). You'll also be able to save bookmarks and upvote posts to show your appreciation to other community members.
With your input, this post could be even better 💗
Register Login